Outliers are known to have negative effects in a Machine Learning model. Unless they are fundamentally a part of the model and its context, it should be avoided and maybe removed from the data entirely.
Using a quantile threshold
One possible way to deal with outliers is to establish a quantile threshold, also known as Tukey’s fences. One could use Interquartile Range or come up with a limit of his own.
import numpy as np
np.random.seed(42)

outliers = np.array([-45, 250, 300, -70])
array = np.concatenate((np.random.normal(100, 50, 50), outliers))

upper_percentile = np.percentile(array, 90)
lower_percentile = np.percentile(array, 10)

filtered_array = np.where((array > lower_percentile) &
                          (array < upper_percentile),
                          array, np.median(array)))

def plot_difference(original_array, filtered_array):
    fig, axs = plt.subplots(ncols=2, figsize=(10,4), sharey="row")
    plt.tight_layout()

    sns.histplot(original_array, ax=axs[0]).set(title="Original Data")
    axs[0].grid(linestyle="dotted")
    axs[0].set_ylabel("")

    sns.histplot(filtered_array, ax=axs[1]).set(title="Filtered Data")
    axs[1].grid(linestyle="dotted")
plot_difference(array, filtered_array);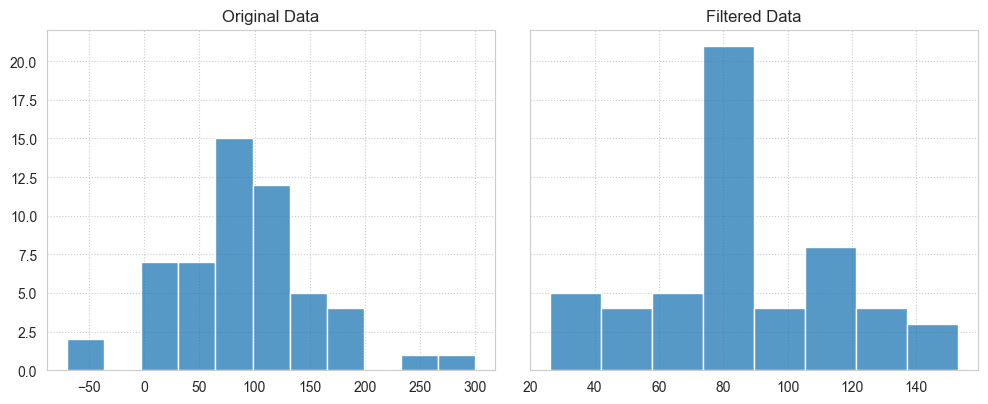
Notice the difference of scales in the x-axis of both plots.
Using cleanlab Outlier Removal
Another great way is to use cleanlab’s OutOfDistribution. Behind the scenes, simply put, is just a K-Nearest Neighbors algorithm that detects those whose distance is greater than expected. Is most commonly used with Data-Centric AI methods.
from cleanlab.outlier import OutOfDistribution
from sklearn.neighbors import NearestNeighbors

array_reshaped = np.reshape(array, (-1, 1))
knn = NearestNeighbors(n_neighbors=3).fit(array_reshaped)
ood = OutOfDistribution({"knn": knn})

scores = ood.score(features=array_reshaped) # Returns probability of being outlier
scores = np.argsort(scores)[:7] # Get the 7 highest scores.

filtered_array = np.delete(array, scores)

plot_difference(array, filtered_array);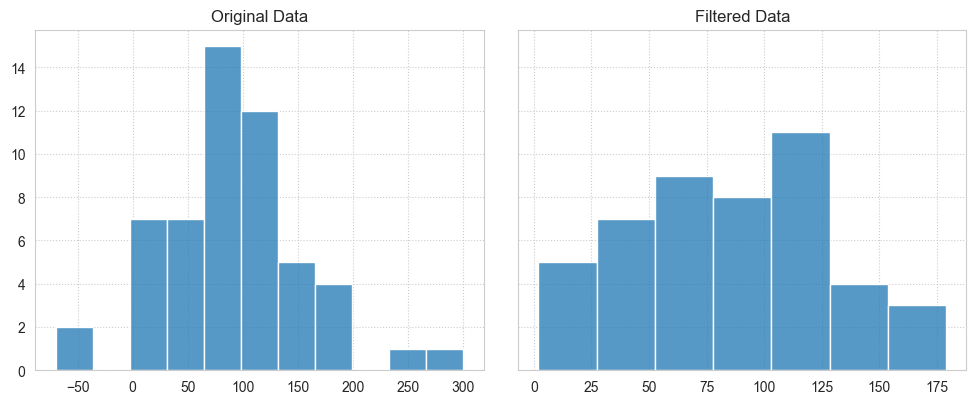
Notice the distribution has not changed much, compared to the quantile method, but some data was lost.