What is it?
Correlation is a statistical measurement that measures the direction and strength of the linear relationship between two numerical variables, meaning these two variables change together at a constant rate.
Correlation is a great for describing simple relationships between variables without making a statement about cause and effect. Even though two variables can be highly correlated, it doesn’t imply causation.

Notation and Definition
The first thing to have in mind when thinking about correlated variables, is that the concept of correlation applies only to linear relationships. More complex, non-linear relationships are not explained by correlation.
Correlation is used in numerical format through a correlation coefficient, with values ranging from to , normally written as — for Pearson’s correlation.
There are various to calculate a correlation coefficient, depending on the type of data, whether being an ordinal, categorical or real-valued. The most commonly used coefficients are Pearson’s and Spearman’s.
Pearson’s Correlation Coefficient
Pearson’s Correlation Coefficient, also called bivariate correlation, is the most used correlation coefficient, and any that someone talks about correlation, one should assume they are talking about Pearson’s.
It evaluates linear relationships between two continuous variables, where a change is one variable relates to a proportional change in the other variable. To apply Pearson’s correlation, one should assume that the data is bivariate, linearly related, and normally distributed.
Given as the number of data point pairs, as the standard deviation and as the variables to correlate, and as the average of said variables, one can calculate Pearson’s correlation using the formula:
Correlation and covariance
Both concepts are very similar, and in fact, the above formula can be interpreted as the ratio between the covariance of and the product of their standard deviation.
In Python, one can easily calculate correlation between two numbers or two arrays:
import pandas as pd
import numpy as np
from statistics import correlation

first_array = np.array([1, 2, 3, 9, 10, 15])
second_array = np.array([-4, -2, 1, 6, 9, 10])

np.corrcoef(first_array, second_array)
correlation(first_array, second_array)
pd.DataFrame({"col1": first_array, "col2": second_array}).corr()
To interpret Pearson’s correlation, take a look at some sample scatter plots and its respective coefficients:

Spearman’s Correlation
Spearman’s Rank Correlation Coefficient, named after Charles Spearman, is another correlation coefficient , which assesses a monotonic relationship between two variables, which means that it’s not constrained to linear relationships like Pearson’s correlation.
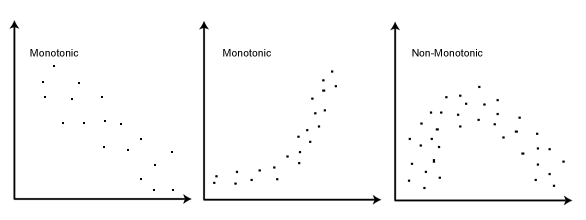
Monotonic relationships
A monotonic relationship of two variables describes the change in a variable when the other one also changes. Monotonic relationships are not constrained by a constant rate. The only constraint is that the function should have a single direction.
Spearman’s correlation can be applied to both continuous and discrete ordinal variables, once it doesn’t use the raw data, using ranks instead of the real values.
To apply Spearman’s correlation, one should assume the data is continuous or ordinal, and monotonically related. Because normality is not an assumption, Spearman’s correlation is also a non-parametric statistic.
Given as Pearson’s correlation coefficient applied to ranked variables, and as the ranks of the variables , one can calculate Spearman’s correlation using the formula:
Using Pearson's correlation to calculate Spearman's
In fact, Sperman’s correlation has extra steps to rank the data before applying the usual Pearson’s. One should rank both variables from smallest to highest, without changing the pair order, and applying Pearson’s correlation to the rank number, instead of the real value.
Ranking the variables before applying Pearson’s correlation distributes data more evenly, making it usable to monotonic relationships and resilient against outliers.
Interpreting correlation values
To interpret a correlation coefficient value, one must first analyse if the data is linearly or monotonically related, depending of the coefficient used. For example, a perfect quadratic relationship may result in :
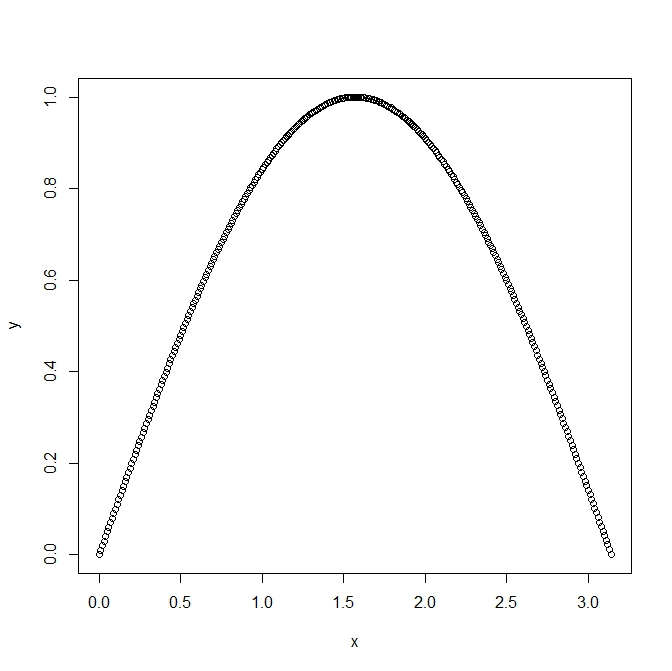
Still, it shows a clear relationship between variables that can be easily understood using a quadratic relationship.
If the assumptions hold, one then, can use a rule of thumb to evaluate how correlated is the variables:

References
-
The Basic Practice of Statistics - David S. Moore, p. 81.
-
Practical Statistics for Data Scientists - Peter Gedeck, p. 68.
-
Spearman’s correlation - Statstutor lecture.