What is it?
The binomial probability distribution is a Statistical Distribution user in Statistics for modelling events that have discrete binomial variables, which can only take two values, positive or negative.
When applied to a series of events, with two possible outcomes, it describes the Probability of getting a certain number of successes in a series of trials.
For example, what is the probability of getting 4 heads in 10 coin tosses? We can easily plot the binomial distribution using SciPy and Python:
import numpy as np
import seaborn as sns
from scipy.stats import binom

number_tosses = 10
probability_success = 0.5  # Assuming a fair coin

x_values = np.arange(0, n + 1)

probabilities = binom.pmf(x_values, n, p)

# Plot the binomial distribution
sns.barplot(y=probabilities, x=x_values)
plt.title("Binomial distribution for 10 coin tosses");
Bernoulli trials and its assumptions
Each coin toss in the past example can be referred as a Bernoulli trial. In reality, each event of a binomial distribution is a Bernoulli trial, which in itself makes some assumptions to properly model the events.
-
There must be only two possible outcomes. If the **success rate is , then the failure rate is .
-
Each outcome must have a fixed probability of occurring.
-
Each trial is completely independent of all others.
Modelling non-independent events
Binomial distribution experiments are made with replacement so each event is independent from one another. For modelling non-independent events, one can use the Hypergeometric distribution.
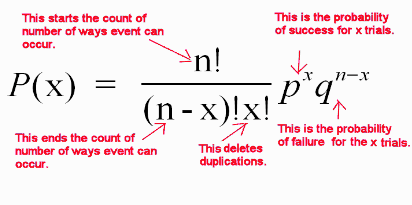
Calculating the probability
Given the number of successes , number of trials , probability of success , and probability of failure , one could use the Probability Mass Function of the binomial distribution to calculate the distribution of a experiment:
Because the average always tend to , the mean of the binomial probability distribution is , and Variance is .