What is it?
In Statistics, ANOVA stands for analysis of variance. It’s a statistical model widely used to compare if two samples are drawn from the same population. It tests for statistically significant difference between different groups or samples.
ANOVA's assumptions
Any ANOVA model assumes that the variables are normally distributed and i.i.d. - independent and identically distributed.
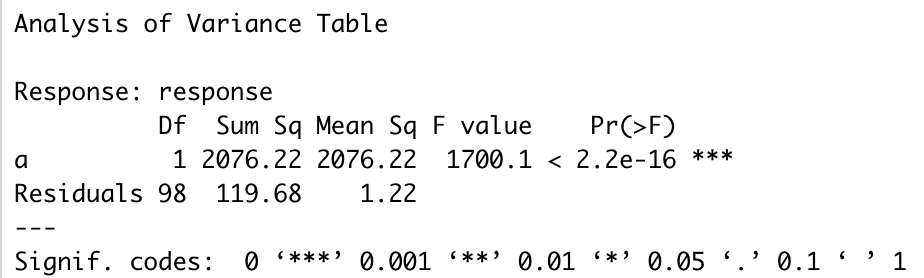
Example of ANOVA table made in R.
Types of ANOVA
When used with a single shared variable between groups, is referred as One-Way ANOVA, being a one-dimensional analysis.
Applied to two or more variables, it captures relationships in multiple dependent variables, being a more reliable tool that takes into account different variables. This procedure is called Multivariate ANOVA.
Interpreting ANOVAplotting residuals
Given that the null hypothesis states that all samples means are equal, and a given significance level also called p-value, , normally set at , we can interpret an ANOVA table using some highlight points.
Checking if means are significantly differently
To determine if the means between each group are statistically different, we look at the value. To be able to reject the null hypothesis, this value needs to be . This would mean the means are actually different.
This is also done by checking the F-statistic and consulting Snedecor’s F-Distribution.
Examine each mean
You can also perform an interval plot of each group, and check its Confidence Interval.
Check fitting and residuals
Metrics like R squared can help to determine if the fitting explained the Variance present in the data, while plotting residuals and checking Heteroscedasticity, normality and if are there any systematic pattern, can help to determine if the model didn’t capture some relationship.